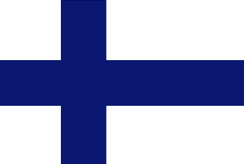
LinkedIn Statistics and data for Finland – 2019

[vc_row lg_spacing=”margin_bottom:80″][vc_column][vc_column_text]

How many LinkedIn users are there in Finland. How much do they share?
How does this relate to the working population?

How many people change jobs, how many new accounts are created on a day?

What are the biggest companies in Finland on LinkedIn?

A lot of interesting stats en facts about the LinkedIn usage in Finland.
[/vc_column_text][/vc_column][/vc_row][vc_row][vc_column][/vc_column][/vc_row][vc_row full_width=”stretch_row_content” content_placement=”middle” background_color=”custom” lg_spacing=”margin_top:10;margin_bottom:120;padding_top:80;padding_bottom:80″ custom_background_color=”#1e73be”][vc_column][vc_column_text css=”.vc_custom_1566037549868{margin-bottom: 80px !important;}”][/vc_column_text][tm_heading tag=”h2″ custom_google_font=”” align=”center” text_color=”custom” custom_text_color=”#ffffff” animation=”none” text=”LinkedIn usage data and statistics for Finland – August 2019″][/vc_column][/vc_row][vc_row content_placement=”middle” lg_spacing=”margin_bottom:120″][vc_column][vc_column_text]

Facts about Finland:


Number of habitants: 5,561,389 people

(according to World of Meters)


Capital: Helsinki


Working population: 2,684,550 people.


In Finland there are 1,005,984 registered LinkedIn accounts. That means that 37.5% of the working population has a LinkedIn account.


Finland ranks number 16 in the relative usage over 44 European countries.


Over the past year, the number of LinkedIn users in Finland has grown with 11.4%.

[/vc_column_text][/vc_column][/vc_row][vc_row full_width=”stretch_row_content” content_placement=”middle” background_color=”custom” lg_spacing=”margin_bottom:120;padding_top:80;padding_bottom:80″ custom_background_color=”#1e73be”][vc_column][tm_heading tag=”h2″ custom_google_font=”” align=”center” text_color=”custom” custom_text_color=”#ffffff” animation=”none” icon_type=”fontawesome” icon_fontawesome=”fa fa-users” text=”LinkedIn member accounts in Finland” icon_font_size=”lg:30″][/vc_column][/vc_row][vc_row content_placement=”middle” lg_spacing=”margin_bottom:120″][vc_column width=”1/2″][vc_line_chart x_values=”AUG ’18;OCT ’18;DEC ’18;MAR ’19;APR ’19; JUN ’19;AUG ’19” values=”%5B%7B%22title%22%3A%22Users%22%2C%22y_values%22%3A%22902788%3B923211%3B928816%3B964509%3B956244%3B982061%3B1005984%22%2C%22color%22%3A%22blue%22%7D%5D” animation=”easeInQuad” css_animation=”fadeInUp” title=”Absolute number of users” css=”.vc_custom_1566932714408{margin-bottom: 80px !important;border-radius: 4px !important;}”][vc_column_text]
This graph shows the absolute number of registered members on LinkedIn for Finland.
[/vc_column_text][/vc_column][vc_column width=”1/2″][vc_line_chart style=”custom” x_values=”AUG ’18;OCT ’18;DEC ’18;MAR ’19;APR ’19; JUN ’19;AUG ’19” values=”%5B%7B%22y_values%22%3A%2233.6%3B34.4%3B34.6%3B35.9%3B35.6%3B36.6%3B37.5%22%2C%22color%22%3A%22sky%22%2C%22custom_color%22%3A%22%2322b8d6%22%7D%5D” animation=”easeInQuad” css_animation=”fadeInUp” title=”Users VS Working population” css=”.vc_custom_1566372874032{margin-bottom: 80px !important;border-radius: 4px !important;}”][vc_column_text]
This graph shows how much percent of the working population for Finland has a LinkedIn profile.
[/vc_column_text][/vc_column][/vc_row][vc_row][vc_column width=”1/2″][tm_counter animation=”odometer” number=”1005984″ text=”People have a LinkedIn profile in Finland.” lg_spacing=”margin_bottom:80″][/vc_column][vc_column width=”1/2″][tm_counter number_suffix=”%” text=”of the working population has a LinkedIn profile in Finland.” lg_spacing=”margin_bottom:80″ number=”37.5″][/vc_column][/vc_row][vc_row][vc_column][vc_cta h2=”FACT” txt_align=”center” style=”custom” custom_background=”#df7237″ custom_text=”#ffffff” css=”.vc_custom_1566762911699{padding-top: 50px !important;padding-right: 50px !important;padding-bottom: 50px !important;padding-left: 50px !important;}”]


According to LinkedIn data, 37.5% of the working population has a profile on LinkedIn in Finland.


18.1% of the total population has a profile on LinkedIn.

[/vc_cta][vc_column_text][/vc_column_text][/vc_column][/vc_row][vc_row full_width=”stretch_row_content” content_placement=”middle” background_color=”custom” lg_spacing=”margin_bottom:120;padding_top:80;padding_bottom:80″ custom_background_color=”#1e73be”][vc_column][tm_heading tag=”h2″ custom_google_font=”” align=”center” text_color=”custom” custom_text_color=”#ffffff” animation=”none” text=”Economic graph”][/vc_column][/vc_row][vc_row lg_spacing=”margin_bottom:120″][vc_column][tm_list_group][vc_column_text]

Finland has a working population of 2,684,550 people. 37.5% of them have a profile on LinkedIn.

6.8% of the people works in Information Technology and Services. 2.8% works in Hospital & Health Care and 2.3% has a job in Government Administration.

[/vc_column_text][vc_row_inner][vc_column_inner width=”1/3″][vc_column_text]


Information Technology and Services
68,894

[/vc_column_text][/vc_column_inner][vc_column_inner width=”1/3″][vc_column_text]


Hospital & Health Care
28,246

[/vc_column_text][/vc_column_inner][vc_column_inner width=”1/3″][vc_column_text]


Government Administration
22,784

[/vc_column_text][/vc_column_inner][/vc_row_inner][/tm_list_group][/vc_column][/vc_row][vc_row lg_spacing=”margin_bottom:80″][vc_column][vc_column_text css=”.vc_custom_1566761555770{margin-bottom: 80px !important;}”]

The most occurring functions in Finland are:


Function Group

Number

% of members

Business Development 114,454 11.4%
Operations 88,267 8.8%
Sales 78,454 7.8%

[/vc_column_text][vc_cta h2=”FACT” txt_align=”center” style=”custom” custom_background=”#df7237″ custom_text=”#ffffff” css=”.vc_custom_1566762857831{padding-top: 50px !important;padding-right: 50px !important;padding-bottom: 50px !important;padding-left: 50px !important;}”]


According to LinkedIn data, on average there are 99 job changes a day on LinkedIn in Finland.

[/vc_cta][/vc_column][/vc_row][vc_row full_width=”stretch_row_content” content_placement=”middle” background_color=”custom” lg_spacing=”margin_bottom:120;padding_top:80;padding_bottom:80″ custom_background_color=”#1e73be”][vc_column][tm_heading tag=”h2″ custom_google_font=”” align=”center” text_color=”custom” custom_text_color=”#ffffff” animation=”none” text=”Growth numbers for Finland”][/vc_column][/vc_row][vc_row][vc_column][vc_column_text css=”.vc_custom_1566373356587{margin-bottom: 50px !important;}”]

The LinkedIn population of Finland has grown over the past year with 11.4%.


Looking over the past three months there has been a growth of 1.9%.


Over the past year, there were 8,600 new members each month.


Meaning 1,985 per week, 283 per day, 12 per hour.


If Finland continues to grow at this speed, they will have 1,109,180 members by August 2020.


Finland ranks number 16 in Europe for growth.

[/vc_column_text][vc_line_chart x_values=”Aug ’18;Oct ’18;Dec’18;Mar ’19;Apr’19;Aug’19” values=”%5B%7B%22title%22%3A%22Monthly%20growth%22%2C%22y_values%22%3A%22.3%3B1.1%3B1.1%3B1.2%3B1.%3B.6%22%2C%22color%22%3A%22sky%22%7D%5D” css=”.vc_custom_1566374101227{margin-bottom: 50px !important;}”][vc_cta h2=”FACT” txt_align=”center” style=”custom” custom_background=”#df7237″ custom_text=”#ffffff” css=”.vc_custom_1566762876423{padding-top: 50px !important;padding-right: 50px !important;padding-bottom: 50px !important;padding-left: 50px !important;}”]


Over the past year, there were 283 new accounts created on LinkedIn per day in Finland.


In last 3 months there were 69 new accounts created per day in Finland.

[/vc_cta][/vc_column][/vc_row][vc_row full_width=”stretch_row_content” content_placement=”middle” background_color=”custom” lg_spacing=”margin_bottom:120;padding_top:80;padding_bottom:80″ custom_background_color=”#1e73be”][vc_column][tm_heading tag=”h2″ custom_google_font=”” align=”center” text_color=”custom” custom_text_color=”#ffffff” animation=”none” text=”Active posting on LinkedIn”][/vc_column][/vc_row][vc_row][vc_column][vc_column_text css=”.vc_custom_1566373662342{margin-bottom: 50px !important;}”]

In Finland there are on average 53 updates posted per hour, 1,277 per day, 8,964 per week and 38,842 per month.


That means that 2.5% of the LinkedIn users in Finland actually posted an update on LinkedIn in August.


Finland ranks number 13 in Europe for active posting.

[/vc_column_text][vc_line_chart x_values=”Aug ’18;Oct ’18;Dec ’18;Apr ’19; Aug ’19” values=”%5B%7B%22title%22%3A%22Active%20%25%22%2C%22y_values%22%3A%222.4%3B4.7%3B4.8%3B6.1%3B2.5%22%2C%22color%22%3A%22sky%22%7D%5D” title=”Active posting over time” css=”.vc_custom_1566374566423{margin-bottom: 50px !important;}”][vc_cta h2=”FACT” txt_align=”center” style=”custom” custom_background=”#df7237″ custom_text=”#ffffff” css=”.vc_custom_1566762937535{padding-top: 50px !important;padding-bottom: 50px !important;}”]


In Finland there are 1,277 updates posted every day.


That equals 53 updates an hour.


And .9 updates a minute.

[/vc_cta][vc_cta h2=”Note” txt_align=”center” style=”custom” custom_background=”#dd3333″ custom_text=”#ffffff”]We have no data about the numbers of articles, likes and comments. This number only represents the times people create a new post on LinkedIn.[/vc_cta][/vc_column][/vc_row][vc_row full_width=”stretch_row_content” content_placement=”middle” background_color=”custom” lg_spacing=”margin_bottom:120;padding_top:80;padding_bottom:80″ custom_background_color=”#1e73be”][vc_column][tm_heading tag=”h2″ custom_google_font=”” align=”center” text_color=”custom” custom_text_color=”#ffffff” animation=”none” text=”Biggest Employers on LinkedIn”][/vc_column][/vc_row][vc_row lg_spacing=”margin_bottom:120″][vc_column width=”1/3″ custom_border_color=”#1e73be” border_style=”dashed” border_radius=”5px” box_shadow=”20px”][tm_spacer size=”lg:80″][tm_heading style=”highlight-big-number” tag=”h1″ custom_google_font=”” align=”center” animation=”none” text=”2″][tm_spacer size=”lg:20″][vc_column_text css=”.vc_custom_1566037108720{margin-bottom: 40px !important;}”][/vc_column_text][tm_spacer size=”lg:20″][tm_heading custom_google_font=”” align=”center” animation=”none” text=”University of Helsinki”][tm_spacer size=”lg:20″][tm_heading tag=”h5″ custom_google_font=”” align=”center” animation=”none” text=”6,904 Employees on LinkedIn”][/vc_column][vc_column width=”1/3″][tm_heading style=”highlight-big-number” tag=”h1″ custom_google_font=”” align=”center” animation=”none” text=”1″][tm_spacer size=”lg:20″][vc_column_text css=”.vc_custom_1566037108720{margin-bottom: 40px !important;}”][/vc_column_text][tm_spacer size=”lg:20″][tm_heading custom_google_font=”” align=”center” animation=”none” text=”Nokia”][tm_heading tag=”h5″ custom_google_font=”” align=”center” animation=”none” text=”6,960 Employees on LinkedIn”][/vc_column][vc_column width=”1/3″][tm_spacer size=”lg:80″][tm_heading style=”highlight-big-number” tag=”h1″ custom_google_font=”” align=”center” animation=”none” text=”3″][tm_spacer size=”lg:20″][vc_column_text css=”.vc_custom_1566037108720{margin-bottom: 40px !important;}”][/vc_column_text][tm_spacer size=”lg:20″][tm_heading custom_google_font=”” align=”center” animation=”none” text=”OP Financial Group”][tm_heading tag=”h5″ custom_google_font=”” align=”center” animation=”none” text=”5,419 Employees on LinkedIn”][/vc_column][/vc_row][vc_row full_width=”stretch_row_content” content_placement=”middle” background_color=”custom” lg_spacing=”margin_bottom:120;padding_top:80;padding_bottom:80″ custom_background_color=”#1e73be”][vc_column][tm_heading tag=”h2″ custom_google_font=”” align=”center” text_color=”custom” custom_text_color=”#ffffff” animation=”none” text=”Company Pages”][/vc_column][/vc_row][vc_row content_placement=”middle” lg_spacing=”margin_bottom:120″][vc_column][vc_column_text css=”.vc_custom_1566761189898{margin-bottom: 50px !important;}”]

In Finland there are 25,647 registered Company Pages.


In August 2018 there were 25,788 registered Company Pages.

[/vc_column_text][vc_line_chart x_values=”aug 18;oct 18; dec 18; apr 18; aug 19″ values=”%5B%7B%22title%22%3A%22Company%20Pages%22%2C%22y_values%22%3A%2225788%3B26952%3B26570%3B28688%3B25647%22%2C%22color%22%3A%22sky%22%7D%5D” title=”Number of registered Company Pages” css=”.vc_custom_1566378998493{margin-bottom: 80px !important;}”][vc_line_chart 0=”title=“Most” 1=”occurring” 2=”industries” 3=”for” 4=”Company” 5=”Pages” 6=”in” 7=”Finland” 8=”css=.vc_custom_1566379764183{margin-bottom: 50px !important;}” x_values=”Information Technology and Services;Marketing and Advertising;Management Consulting” values=”%5B%7B%22title%22%3A%22Top%203%20-%20percentage%20of%20total%20Company%20Pages%22%2C%22y_values%22%3A%2210.7%3B5.6%3B4.1%22%2C%22color%22%3A%22sky%22%7D%5D”][vc_column_text]

Industry Percentage
Information Technology and Services 10.7%
Marketing and Advertising 5.6%
Management Consulting 4.1%

[/vc_column_text][/vc_column][/vc_row][vc_row full_width=”stretch_row_content” background_color=”custom” lg_spacing=”margin_bottom:80;padding_top:50;padding_bottom:50″ custom_background_color=”#df7237″][vc_column][tm_heading tag=”h2″ custom_google_font=”” align=”center” text_color=”custom” custom_text_color=”#ffffff” animation=”none” text=”Want to know more?” css=”.vc_custom_1566848210983{margin-bottom: 0px !important;padding-top: 0px !important;padding-bottom: 0px !important;}”][/vc_column][/vc_row][vc_row][vc_column][tm_w_better_custom_menu][/vc_column][/vc_row][vc_row lg_spacing=”margin_bottom:50″][vc_column width=”1/3″][vc_column_text]

Follow the researcher on LinkedIn.

[/vc_column_text][/vc_column][vc_column width=”1/3″][vc_column_text css=”.vc_custom_1567858423888{margin-bottom: 50px !important;}”]

Book me as a Speaker about LinkedIn in your country?


I can give a compelling, entertaining and informative presentation about the Power of LinkedIn, specified to your local audience.

Use our contact page to receive more information.[/vc_column_text][vc_btn title=”Contact” color=”warning” align=”center” link=”url:https%3A%2F%2Fnextbusinessacademy.nl%2Fen%2Fcontact-us%2F|title:Contact%20us||”][/vc_column][vc_column width=”1/3″][vc_column_text css=”.vc_custom_1566848787573{margin-bottom: 50px !important;}”]

Interview about this research?

Use our contact page to receive more information.[/vc_column_text][vc_btn title=”Contact” color=”warning” align=”center” link=”url:https%3A%2F%2Fnextbusinessacademy.nl%2Fen%2Fcontact-us%2F|title:Contact%20us||”][/vc_column][/vc_row][vc_row content_placement=”top” lg_spacing=”margin_bottom:50″][vc_column width=”1/3″][vc_column_text]

Want to reach your target audience in this country?

We can serve you with premium advertising services on LinkedIn.

[/vc_column_text][/vc_column][vc_column width=”1/3″][vc_wp_custommenu title=”More data Europe” nav_menu=”171″][vc_column_text]


Albania
[/vc_column_text][/vc_column][vc_column width=”1/3″][vc_wp_custommenu title=”Other info” nav_menu=”172″][/vc_column][/vc_row][vc_row][vc_column][vc_column_text css=”.vc_custom_1567858344112{margin-top: 120px !important;margin-bottom: 120px !important;}”]

Check out the data for your country


Albania


Austria


Belarus


Belgium


Bosnia and Herzegovina


Bulgaria


Croatia


Czech Republic


Denmark


Estonia


Finland


France


Germany


Greece


Hungary

Iceland


Ireland


Italy

Latvia


Lithuania


Luxembourg


Macedonia


Malta


Moldova


Montenegro


Netherlands


Norway


Poland


Portugal


Romania


Russian Federation


Serbia


Slovakia


Slovenia


Spain


Sweden


Switzerland


Ukraine


United Kingdom

[/vc_column_text][/vc_column][/vc_row]